ComBank donates another 5 fully-equipped IT labs
Businesscafe - The Commercial Bank of Ceylon has extended the reach of its national IT education initiative to encompass five more government teaching institutions to which the Bank recently donated fully equipped IT labs, and where necessary, conducted building renovations.
The latest beneficiaries of the Bank’s flagship corporate social responsibility programme are the Kudagammana Maha Vidyalaya in Walpita, Karunarathna College in Kotadeniyawa, Thawalampitiya Maha Vidyalaya and Henepola Vidyaloka Vidyalaya in Mirigama, and the Vocational Training Authority of Sri Lanka (VTA) in Rajagiriya.
The Bank’s donations included computers and chairs, printers and multimedia projectors.
In addition, the Bank also invested in the renovation and expansion of the existing IT lab facilities at some of these institutions.
While the schools cater to students from grades 1 to 13 and require IT labs to teach ICT which is a compulsory subject in the curriculum, the VTA needed 10 new computers to ensure the continuation of the twice-weekly computer courses, currently conducted for 30 students.
Beside steadfastly continuing with the donation of fully-equipped IT labs, the Bank, which is one of the largest contributors towards IT education in Sri Lanka, also supported a project to set up 100 classrooms that focus on the STEM subjects and is funding projects to set up math labs in schools and to enhance vocational training opportunities for students that do not qualify for higher education.
Additionally, Commercial Bank is funding a 150-hour IT hardware course conducted in collaboration with the Academy for ICT skills and Development and CISCO Networking Academy in selected schools.
While the CISCO Networking Academy provides the course fee free of charge for the students, the Bank sponsors the lecture fee of the course.
The Bank has also supported the ‘IT Essentials-Instructor’ certificate course for teachers at the CISCO Networking Centre at the University of Moratuwa under this programme.
Sri Lanka’s first 100% carbon neutral bank, the first Sri Lankan bank to be listed among the Top 1000 Banks of the World and the only Sri Lankan bank to be so listed for 12 years consecutively, Commercial Bank operates a network of 268 branches and 940 automated machines in Sri Lanka.
Commercial Bank is the largest lender to Sri Lanka’s SME sector and is a leader in digital innovation in the country’s Banking sector.
The Bank’s overseas operations encompass Bangladesh, where the Bank operates 19 outlets; Myanmar, where it has a Microfinance company in Nay Pyi Taw; and the Maldives, where the Bank has a fully-fledged Tier I Bank with a majority stake.
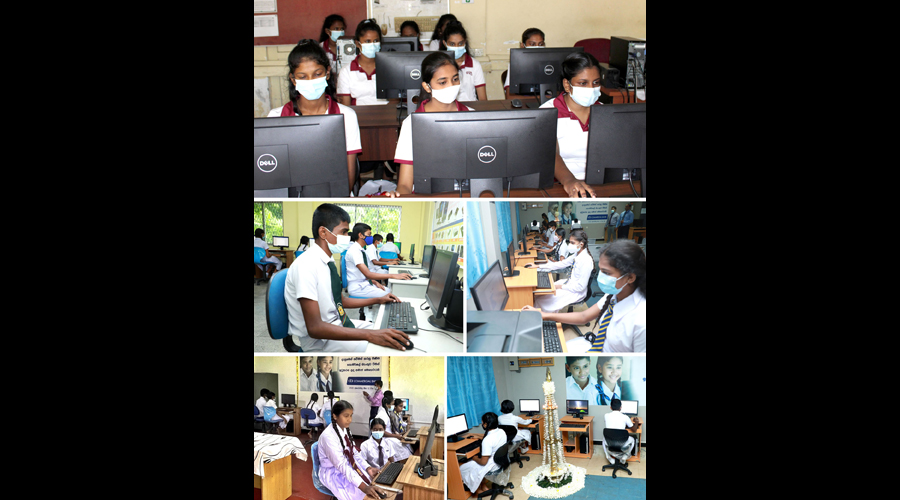
Photo Caption The latest IT Labs donated by Commercial Bank.